Introduction
Zabbix is a great monitoring tool that collects data from servers, virtual machines, and other kinds of network devices so you can analyze it for trends or problems. It has feature-rich notifications on emerging issues, but the built-in tools for data analysis and visualization are not easy to use. You can combine graphs into dashboards, but first you need to create them, and there is practically no easy way to create graphs that display real-time data. Also,to there is no way to collect data from different hosts onto a single graph. While the situation is getting better with each new release, it is far from ideal.
Grafana is a good alternative to Zabbix's dashboards. It lets you create graphs and dashboards based on data from various monitoring systems, and it specializes in the display and analysis of this data. It is lightweight, easy to install, and it looks beautiful.
In this tutorial, you'll install Grafana and configure it to display data from Zabbix, and you'll learn how to compose your own custom dashboard that monitors CPU and file usage.
Prerequisites
To follow this tutorial, you will need:
- Two CentOS 7 servers configured with sudo non-root users, with Zabbix installed on one server, and the Zabbix client installed on the other server. Follow the tutorial How To Install and Configure Zabbix to Securely Monitor Remote Servers on CentOS 7 and its prerequisites to configure these servers.
Step 1 — Installing Grafana
Before we can use Grafana, we need to install it. We'll use the same server we used for the Zabbix server. Log in to your Zabbix server with your non-root user:
- ssh sammy@your_zabbix_server_ip_address
Grafana isn't available through the package manager by default, so we will set up the repository configuration file. First, create a new repository file for Grafana:
- sudo vi /etc/yum.repos.d/grafana.repo
Paste the following configuration data into the file:
[grafana]
name=grafana
baseurl=https://packagecloud.io/grafana/stable/el/6/$basearch
repo_gpgcheck=1
enabled=1
gpgcheck=1
gpgkey=https://packagecloud.io/gpg.key https://grafanarel.s3.amazonaws.com/RPM-GPG-KEY-grafana
sslverify=1
sslcacert=/etc/pki/tls/certs/ca-bundle.crt
Then save and exit the text editor and run the following command to install Grafana:
- sudo yum install grafana
During the installation process you will be asked to import a GPG key. Confirm that you wish to import this key so the installation can continue.
Once the installation completes, start the Grafana service:
- sudo systemctl daemon-reload
- sudo systemctl start grafana-server
Then check whether the Grafana service is running properly:
- sudo systemctl status grafana-server
You will see the following status:
Output● grafana-server.service - Starts and stops a single grafana instance on this system
   Loaded: loaded (/usr/lib/systemd/system/grafana-server.service; enabled; vendor preset: disabled)
   Active: active (running) since Mon 2016-11-07 06:18:27 UTC; 1 day 4h ago
     Docs: http://docs.grafana.org
 Main PID: 16639 (grafana-server)
  ...
Finally, enable the service to start at boot time:
- sudo systemctl enable grafana-server
Grafana is running, so let's install the component that lets Grafana pull data from Zabbix.
Step 2 — Installing the Zabbix Plugin for Grafana
You can extend Grafana's functionality by installing plugins. You can explore the available plugins here. There are three types of plugins:
- Panels: new blocks that can be used on the dashboard, such as pie charts or histograms.
- Data sources: new storage backends for your time series data, so you can pull data from other sources.
- Apps: complex plugins that bundle data sources and panels within a single package.
We will use the Zabbix app plugin, which includes a Zabbix data source, a triggers panel, a Zabbix server dashboard, and a template to view data.
The easiest way to install plugins is by using the CLI tool grafana-cli which is bundled with Grafana. Run the following command to install the Zabbix App plugin:
- sudo grafana-cli plugins install alexanderzobnin-zabbix-app
You will see the following output, indicating that the plugin was installed:
Output✔ Installed alexanderzobnin-zabbix-app successfully
Whenever you add or modify plugins, you must restart grafana-server for the changes to take effect.
- sudo systemctl restart grafana-server
With the plugin installed, you can log in to Grafana and configure it to talk to Zabbix.
Step 3 — Configuring the Zabbix Plugin
Log in to the Grafana web interface by navigating to the address http://your_zabbix_server_ip_address:3000.
Note: Grafana listens for incoming connections on port 3000. If you have a firewall configured, you'll need to open this port. Review this tutorial to learn about the firewall in CentOS if you run into issues.
The default login credentials are admin/admin. You can change your password on the Profile page once you log in. When you log in, you'll be greeted by the Home dashboard.
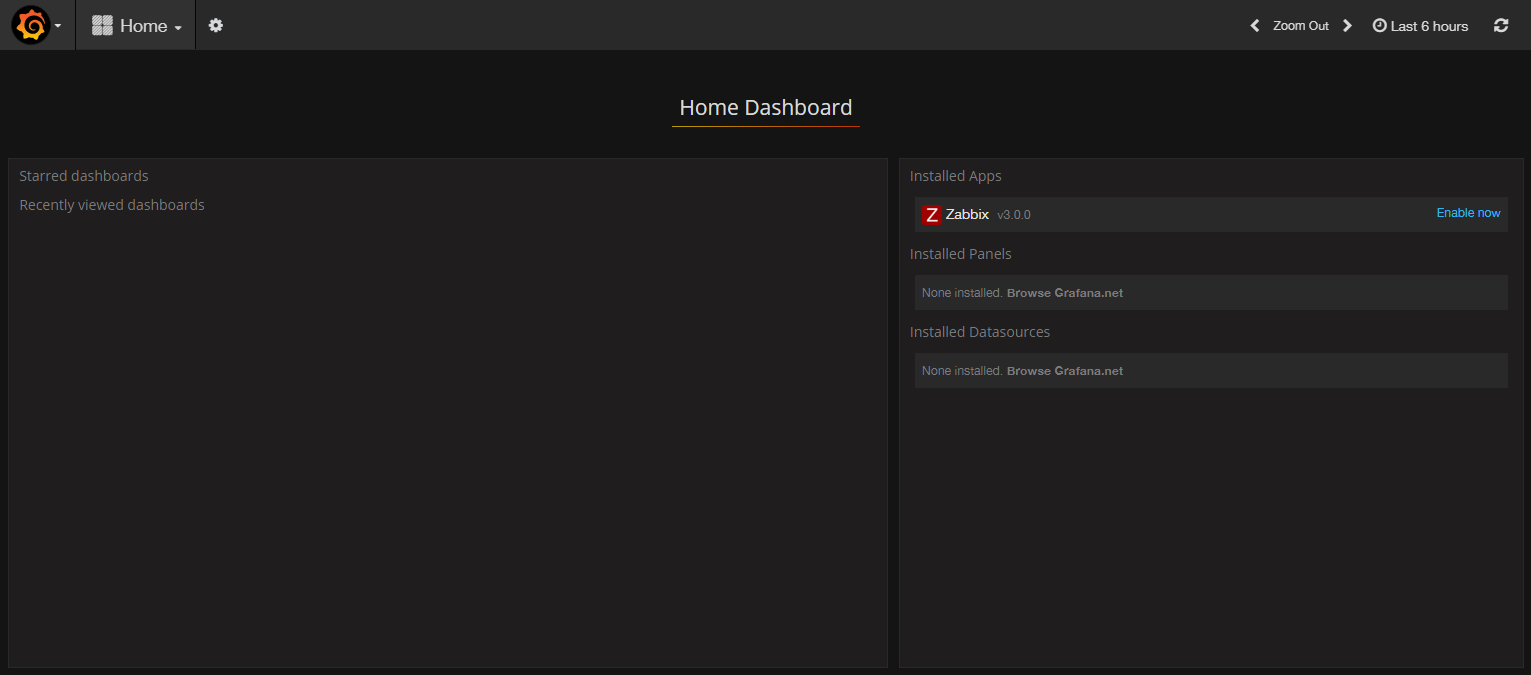
Access Grafana's main menu by clicking on the Grafana logo in the top left corner of the user interface. Then select Plugins. Then select the Apps tab. Then click on the Zabbix app and enable it by pressing the Enable button.
Now you can add a new data source. Select the Grafana logo again and navigate to Data sources. Then click the Add data source button. You will see the configuration page for the data source:
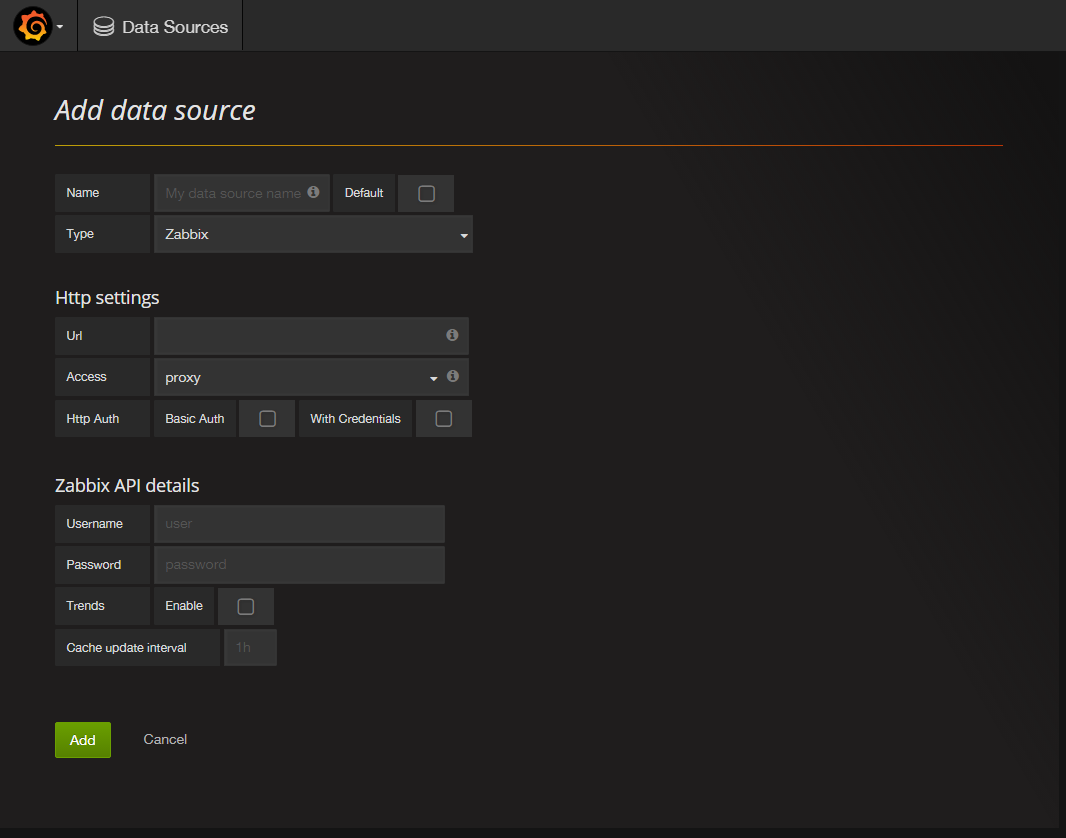
Configure the data source as follows:
- Enter a name for this new data source in the Name field.
- Check the Default option so this data source will be preselected in new panels you create.
- Select Zabbix from the Type drop down list.
- Fill in the Url field with the full path to the Zabbix API, which will be
http://your_zabbix_server_ip_address/zabbix/api_jsonrpc.php. - Fill in the Username and Password fields with the username and password for Zabbix. The default username is
adminand the default password iszabbix. - Enable the Trends option; it will increase Grafana's performance when displaying long time periods.
You can leave the other options at their default values.
Click the Add button to test and save the configuration. You'll see a success message that looks like the following:
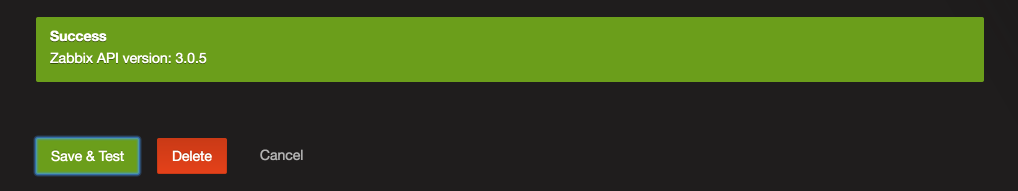
If you do not see this message, check your credentials and test again.
'IT 이야기 > Linux' 카테고리의 다른 글
| zabbix_agent (solaris 10) 특이사항2 (0) | 2017.05.12 |
|---|---|
| zabbix_agent (solaris 10) 특이사항 (0) | 2017.05.12 |
| zabbix 설치 과정 (Centos 6) (0) | 2017.05.12 |
| LVS Tun 테스트중...(쉽지않음) (0) | 2016.04.18 |
| 아파치 에러 코드 & apache error code (0) | 2015.10.17 |